
I want to talk about a setting that you should usually never touch besides verifying it’s at the Microsoft recommended value. Then, I’ll tell you about why I touched it anyway. Sometimes that red button is too shiny.

Our story begins on a test server hosting a couple hundred databases. Over time, the server kept getting slower and slower when trying to navigate in SSMS. Query windows would take too much time to load, logging in would lag a bit, etc. When investigating with sp_Blitz, I found that the server had been experiencing Threadpool waits.
What are Threadpool Waits?
Threadpool waits occur when there are not enough threads available to handle the requests being made. The symptoms are what I mentioned above. SQL Server will seem sluggish or seem to be freezing up.
Common Threadpool Wait Scenarios
You may have queries that are simply taking too long to run and SQL Server isn’t able to keep up. If you suddenly started seeing Threadpool waits, did something recently change with your queries? Are queries causing more locks leading to a build up of blocked threads?
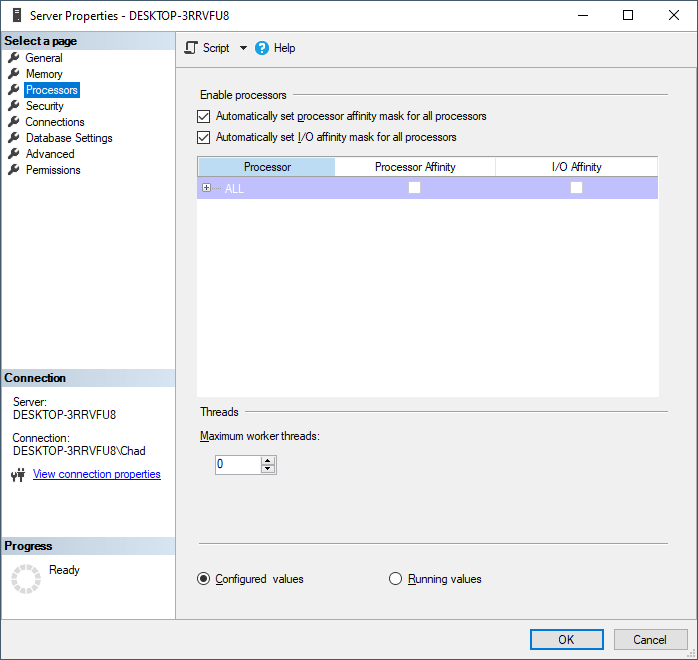
Another reason may be due to the maximum worker threads setting being set too low. If you’re wondering if this is the case, right click on your server in Object Explorer, select Properties, then Processors, and check Maximum worker threads towards the bottom.
Compare your settings against what Microsoft recommends:
| Number of CPUs | 32-bit computer (up to SQL Server 2014 (12.x)) | 64-bit computer (up to SQL Server 2016 (13.x) SP1) | 64-bit computer (starting with SQL Server 2016 (13.x) SP2 and SQL Server 2017 (14.x)) |
|---|---|---|---|
| <= 4 | 256 | 512 | 512 |
| 8 | 288 | 576 | 576 |
| 16 | 352 | 704 | 704 |
| 32 | 480 | 960 | 960 |
| 64 | 736 | 1472 | 1472 |
| 128 | 1248 | 2496 | 4480 |
| 256 | 2272 | 4544 | 8576 |
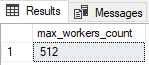
Don’t be worried if you check this value and see your setting as 0. That’s actually a good thing. That means nobody has been messing around with the setting because 0 is the default and translates to whatever value you find when running the following query:
SELECT max_workers_count
FROM sys.dm_os_sys_info;
GO
SQL Server comes up with that value based on the formula:
Default Max Workers + ((Logical CPUs – 4) * Workers per CPU)
Our Story Continues
In my case, the server shouldn’t have had many active sessions. The databases were rarely being accessed and if they were accessed it was not all at once. At least that’s what it looked like from the outside. When running sp_WhoIsActive to take a look at activity, I found this:
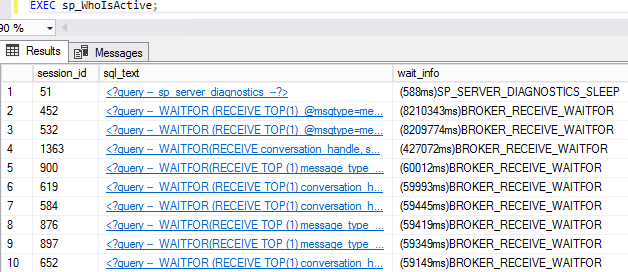
While the screenshot only shows 10, there were hundreds and hundreds of Service Broker messages. Service broker was the culprit hogging all of the threads with BROKER_RECEIVE_WAITFOR. Since the server was not production and I could tell what load it was going to be under, I decided to increase the maximum worker threads beyond the recommendation. In this case it “fixed” the problem.
If this was in production and all of the databases were going to be under load, performance could crash and burn. Instead of changing maximum worker threads, it would be time to talk about adding CPUs or spreading the load across servers.
Thanks for reading!

One thought on “A Threadpool Story”